We Counted 2 Million Student Creations. Here's What We Found.
Today we're publishing The Student Participation Report, an analysis of 16,761 interactive learning Experiences that K-12 educators ran on Goosechase during 2025.
It's our first report built entirely from platform data, and it exists because of a gap that's been bothering us for a while.
Why We Made This
Almost everything published about student engagement is survey data. Someone asks students how engaged they feel, or asks teachers how engaged they think their students are, and the answers get charted.
Self-reported data is useful, but it has an obvious limitation: it measures what people say about an experience, not the experience. Nobody in our dataset was asked to rate anything from 1 to 5. We counted what students made, what they finished, and how much of it they did together.
That's a narrower claim than most engagement research makes, and we think it's a more solid one.
What's in It
Five findings, drawn from a full year of activity:
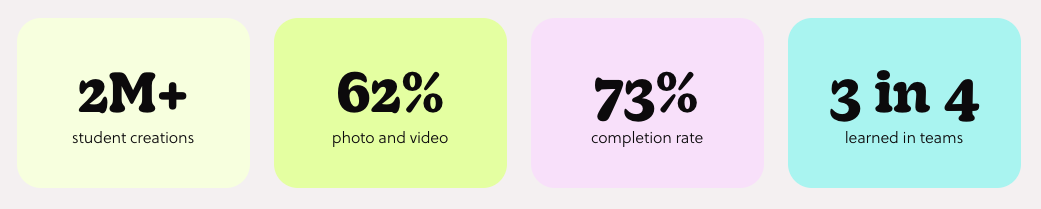
1. Students create rather than consume. Across the year, students produced more than 2 million pieces of work: photos, videos, written responses, and location check-ins. Most of it was made with a camera, pointed at the real world.
2. Collaboration is the default. 76% of students took part as a team rather than solo. Teams frequently share one device, so the collaboration is literal: one camera, one screen, one very loud debate about which Mission to tackle next.
3. Engagement finishes, not just starts. The typical group completed 73% of the tasks assigned to it. Attendance tells you who turned up. Completion tells you who stayed in it.
4. Teachers reach for this at the start of the year. August and September are the two busiest launch months, with a second peak in May. This isn't a year-end treat. It's what educators use when they're building a room full of strangers into a class.
5. It fits inside a real prep window. Nearly half of these Experiences were built and launched on the same day. Experiential learning has a reputation for being heavy to plan, and the data quietly disagrees.
The full report has the numbers behind each of these, the charts, and the complete methodology.
What It Doesn't Say
We were careful about this one, so it's worth stating plainly here too.
This is participation data, not achievement data. It shows what students did, not what they learned. It doesn't measure retention, test scores, or anything downstream of the lesson itself. The educators in this dataset also chose an interactive format in the first place, so the findings describe what happens when that choice gets made, rather than K-12 instruction generally.
We'd rather publish a narrow claim we can stand behind than a broad one we can't.
It's Free to Use
The report is public, and it's built to be cited. There's a section with ready-to-use sentences for anyone writing about student engagement, along with the full methodology: what we counted, how we defined completion, what the numbers undercount, and where the limits are.
All figures are aggregate, platform-level counts. No individual, school, or district-level data was reported.
If you're a teacher, the section called "What this means if you teach" is the one to start with. If you're a journalist or researcher, start with the methodology and work up.
Free, ungated, and built to be cited.