Streamlining Forecasting in SaaS: How Goosechase Simplified the Complex Process
SaaS companies typically have multiple forecasts, which can be complex, time-consuming, and confusing. We’ve created a new model that brings all these forecasts together.
When I was asked to create a revenue forecast, I can't lie - I was nervous. Will I get the numbers right? What data points and methods will drive this forward? Why the nerves?…

Hi! I'm Ally. I manage the revenue data here at Goosechase. I'm also a Sphynx cat superfan, which should let you know that I'm not easily put off by what most people view as scary! I'm going to take you through Goosechase’s process of revenue forecasting and provide a new perspective on how forecasting can be done, and I promise, it's going to be a lot less scary than you think.
What is revenue forecasting and why is it important?
Revenue forecasting uses historical data and educated assumptions about your business, industry, and economy to estimate your company’s future gross sales. In other words, it predicts how much money your business is going to make in the future. It's all about taking a look at past performance, understanding the factors that drive your revenue, and using that information to make educated guesses about what's going to happen in the future.
Forecasting is an essential process for every company. A forecast is important because it helps with budgeting, decision-making, company goals…the list goes on. With all data points properly considered, an accurate forecast can prepare your company for whatever the future holds. The complication is that there are many ways in which a forecast can be done, and no accurate way to guess what’s right for you…until you actually do it.
I’d be lying if I said we’ve always nailed our forecasts. In the past, like most SaaS companies, we created multiple forecasts, each focused on a single metric. This meant that we had separate forecasts for different aspects of our revenue operations, such as website traffic and sales. While this approach provided some level of insight, it also made it difficult to understand how these metrics interacted with each other and how changes in one area of the business impacted overall performance.
Our forecasts also fell short because we didn’t include qualitative data, i.e. our judgment! Growth insights based on experience, our knowledge of our customers, our markets, and good old-fashioned intuition.
The solution? We needed a forecasting model that was centralized, gave a clear view of the entire revenue journey, and could account for both quantitative and qualitative insights.
*Sales & Marketing funnels enter the chat*

The difference between a Marketing Funnel vs Sales Funnel
Before we dive deeper into how we revolutionized our forecasting model, we first need to understand funnels:
A marketing funnel is a series of steps that a potential customer goes through in order to become aware of a product and ultimately become a customer.
A sales funnel is a series of steps, also known as stages, that a potential customer goes through in order to make a purchase.
The sales funnel is narrower and more focused on the end goal of making a purchase, while the marketing funnel is broader and more focused on building awareness and interest.
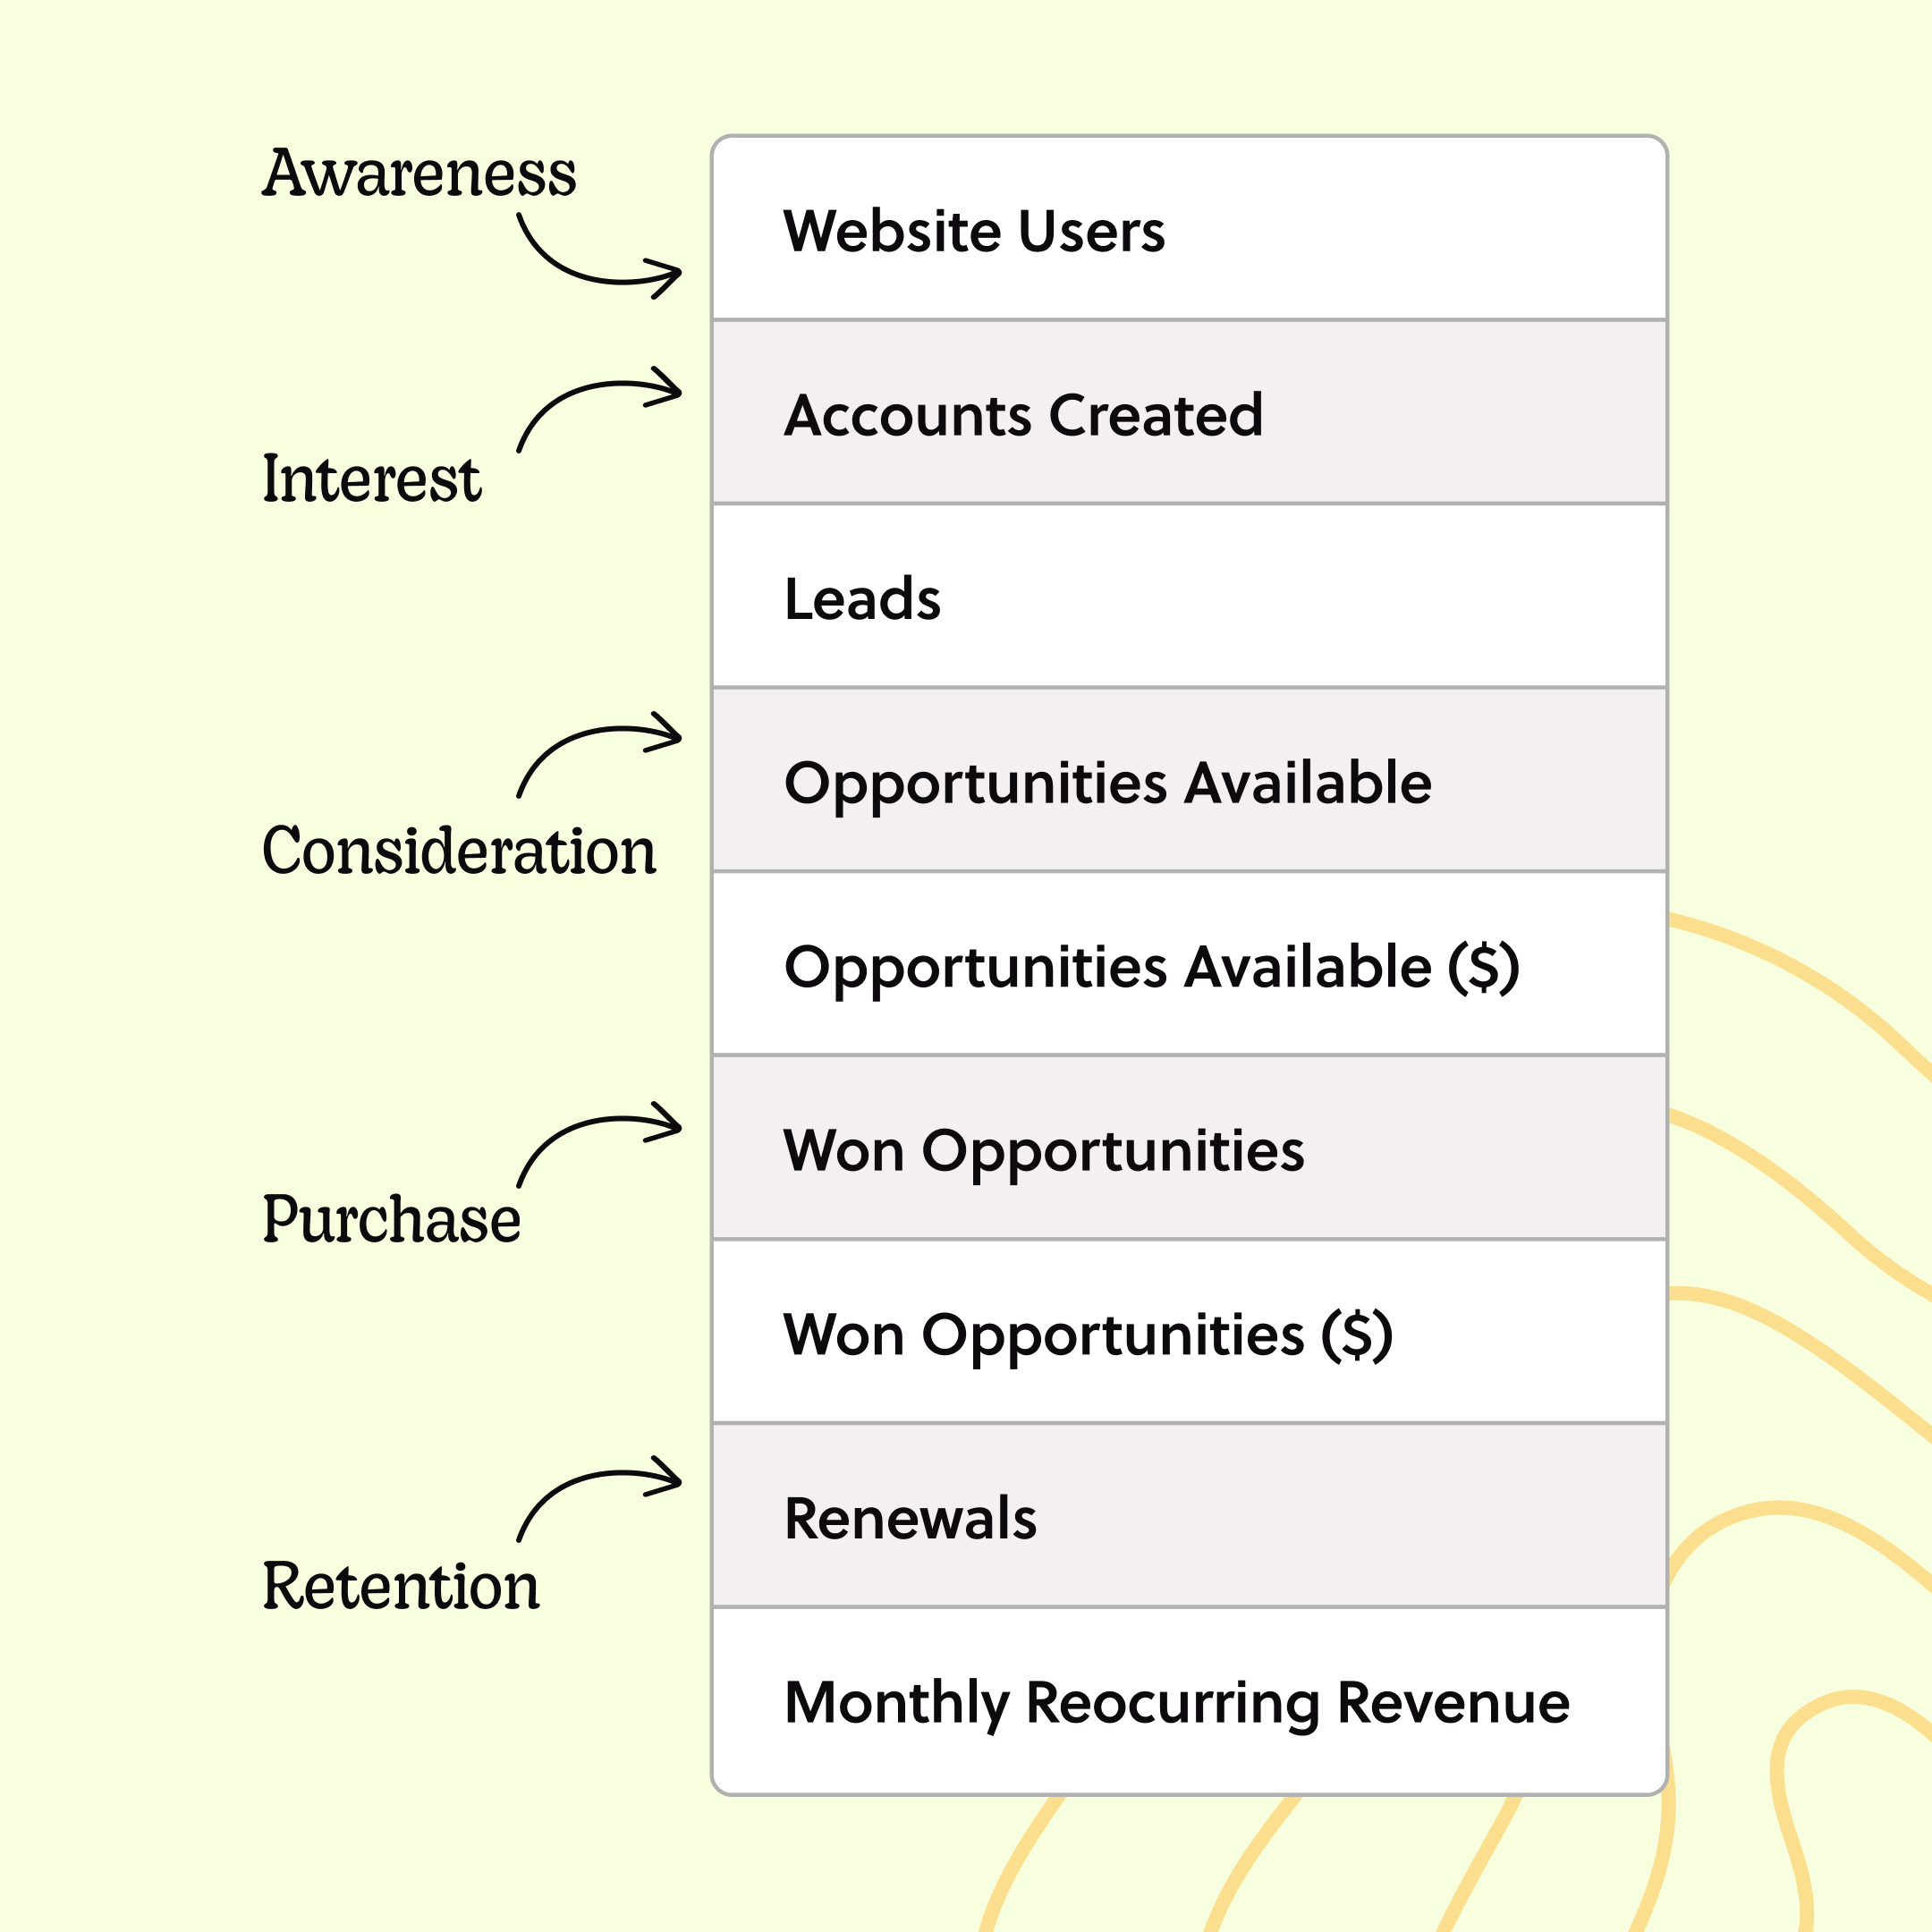
The steps in both funnels can be summarized as:
- Awareness
- Interest
- Consideration
- Purchase
- Retention
Conversion rates, which are integral to forecasting, refer to the percentage of individuals who move from one stage of the funnel to the next. In short, funnels help show what areas of our revenue organization are strong and what need improvement. When thinking about which metrics would ‘account for it all’ and help us build a forecast for 2023, these funnels provide great insight.

How to Build a Dynamic Revenue Forecast
Greeeeat question. With a forecast to build, and using marketing and sales funnels as a guide, I got to work. Google Spreadsheets became my best friend (A sentence I never thought I’d say). It allowed me to access all the necessary data points, and it’s a great tool for collaboration, meaning I could easily ask questions and pull in feedback from the rest of the team.
While pre-made forecasting templates can be useful, they may not always meet the specific needs of the business (I also couldn’t find any good funnel-inspired forecast templates, trust me… I looked). And so with the help of my team, we began mapping out a funnel that identified key metrics and years that were most important to include in our forecast.

After pulling in these metrics from previous years, we could see how our conversion rates had evolved over different time periods. We then had to consider how each of these metrics impacted the other. We also had to include a judgment component, where we could incorporate additional growth assumptions that would be reflected in our overall forecast. What we came up with is pretty special.
The Final Product: A New and Improved SaaS Forecast
Our forecast involves utilizing past data points and conversion rates to predict key revenue metrics within our organization, such as website traffic, sales, MRR, leads, and retention. It's important to note that the performance of each stage of the funnel is interconnected, and any changes in one stage will have an impact on the later stages. We aren’t just viewing these metrics as standalone numbers, but instead, we use the conversion rates from each stage to help calculate our forecast.

We have added the capability to expand or collapse rows, which allows us to get a detailed breakdown of each stage, enabling us to identify areas that are performing well or not. We also account for the judgment piece by including a manual input of an overall website traffic growth percentage at the beginning of the period, as traffic is at the top of the funnel and drives the performance of later stages.
As this forecast is intended for all members of our revenue team and isn't limited to our data and management teams, we took it one step further and added a column that can be manually adjusted, which serves as a learning tool for each member of our flock. This forecast encompasses multiple aspects of our business, such as our Account Executive's ability to see the impact of improving lead to opportunity conversion or the Head of Brand Experience's ability to set growth goals for website traffic. This forecast is designed to be inclusive and beneficial for all members of our revenue team, it helps us to understand where and how we can each make a positive impact on the business.
I guess you could say we made our funnel more human. Which feels incredibly on-brand.
In the end, this is what we ended up with:
One forecast for the entire revenue org ✔
which includes quantitative and judgment data ✔
and that’s collaborative and easy to use ✔
But, does it work?
So far, this forecast proves to be successful. Our actual performance is in line with what we had forecasted, however, we will not be able to confirm the accuracy of our forecast until the end of the first quarter. For now, we're able to make proactive decisions on which areas of the business we need to focus on and are able to make adjustments accordingly. This new forecasting model we're testing provides visibility into the key revenue metrics that are important to us at Goosechase and allows us to make informed decisions.
Revenue forecasting may seem daunting at first, but with the right resources and understanding, it can be a powerful tool to help guide your business toward success. Embrace this new perspective and don't be afraid to dive in, it's not as scary as it seems.
What is Goosechase?
At Goosechase, experience is everything. Originally inspired by scavenger hunts, Goosechase is an online platform that enables organizations and schools to engage, activate, and educate their communities through delightful interactive experiences. Sign up and try creating a free recreational Experience, or check out our Pricing!


